Provides pan-India variation in prosperity at pincode level.
Derived from household asset penetration in following categories:
1. Electricity Connection
2. LPG/PNG Connection
3. Bank Account
4. Television
5. Telephone
6. Computer/Laptop
7. Computer/Laptop with internet
8. Two Wheeler
9. Four wheeler
10. Ownership of TV, Computer/Laptop, Landline/Mobile Phone and Scooter/Car
Unlock India's Latest Insights: 2021 estimates for Population and Per capita Income Now Available!
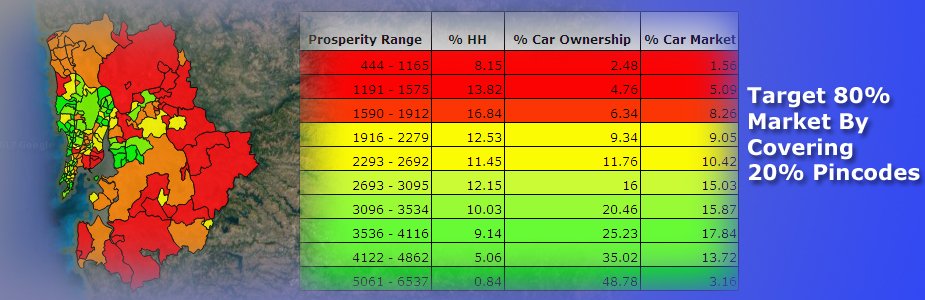
Provides intra-city variation in prosperity at ward level for top cities of India.
Derived from household asset penetration in following categories:
1. Electricity Connection
2. LPG/PNG Connection
3. Bank Account
4. Television
5. Telephone
6. Computer/Laptop
7. Computer/Laptop with internet
8. Two Wheeler
9. Four wheeler
10. Ownership of TV, Computer/Laptop, Landline/Mobile Phone and Scooter/Car
Unlock India's Latest Insights: 2021 estimates for Population and Per capita Income Now Available!
Provides boothwise results for last few elections for micro level planning.
Which way did the votes of a particular locality go? Which locality came out strongly in support of a particular candidate? Cluster of which polling booths was lost by a Big margin. Which areas demonstrated unstinting support? Which polling booths were ambivalent?
Harness the Power of Data: Turning Information into Actionable Insights
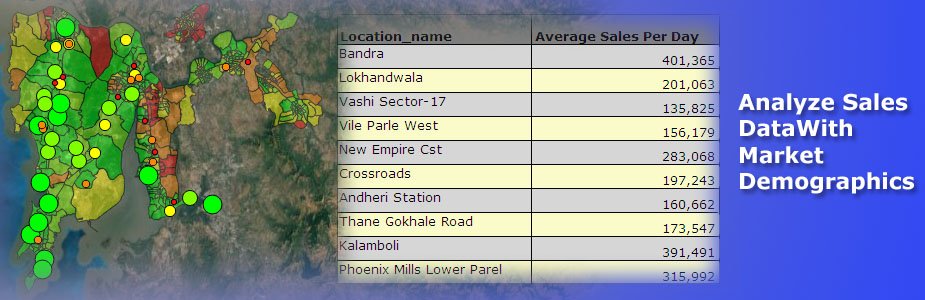
Data is becoming increasingly accessible, with governments releasing datasets publicly and companies sharing detailed information about their products and networks online. Organizations are capturing vast amounts of transactional data, significantly reducing the cost of data acquisition.
However, extracting meaningful insights from these enormous datasets is becoming increasingly challenging. While data itself becomes cheaper, the cost of insights derived from this data continues to rise. Organizations are looking to integrate their internal data with external datasets. Maps offer an ideal solution to merge, visualize, and interpret these diverse datasets, unlocking valuable insights to drive strategic decisions.
Predictive models further enhance this process. They forecast trends and identify potential opportunities. Using advanced analytics and machine learning, organizations can proactively address challenges and confidently make data-driven decisions.